
Email flow testing
When markets move fast, clients call faster. These five visuals help you lead the conversation instead of reacting to it.

Sarah Okonkwo
Senior Content Strategist, Scatterplot

Lydia Korsgaard
Guest Writer, Scatterplot Blog
Intro
Volatility doesn't announce itself. One morning the market is steady; by afternoon your phone is full of messages from clients who watched the news and want answers. The advisors who handle those calls best aren't the ones with the most information — they're the ones with the clearest visuals ready to go.
iiiiii
These five charts won't predict the next correction.
But they'll help you contextualize it, calm the room, and keep clients focused on what matters.
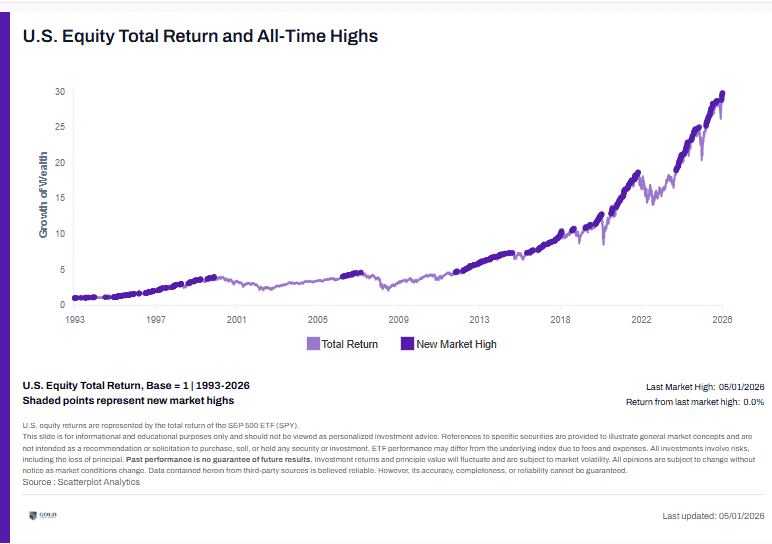
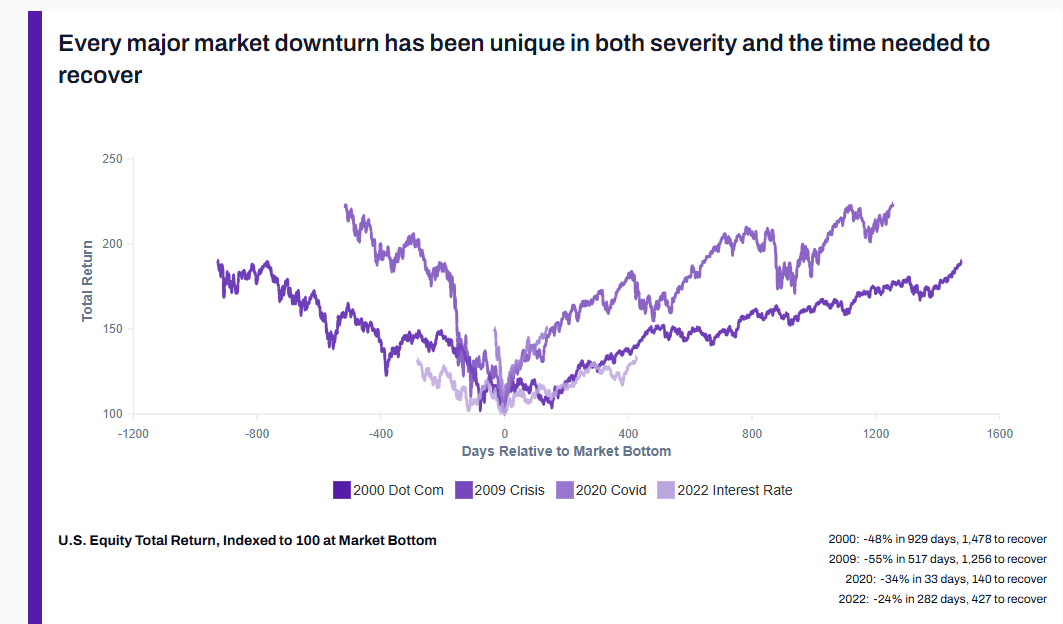
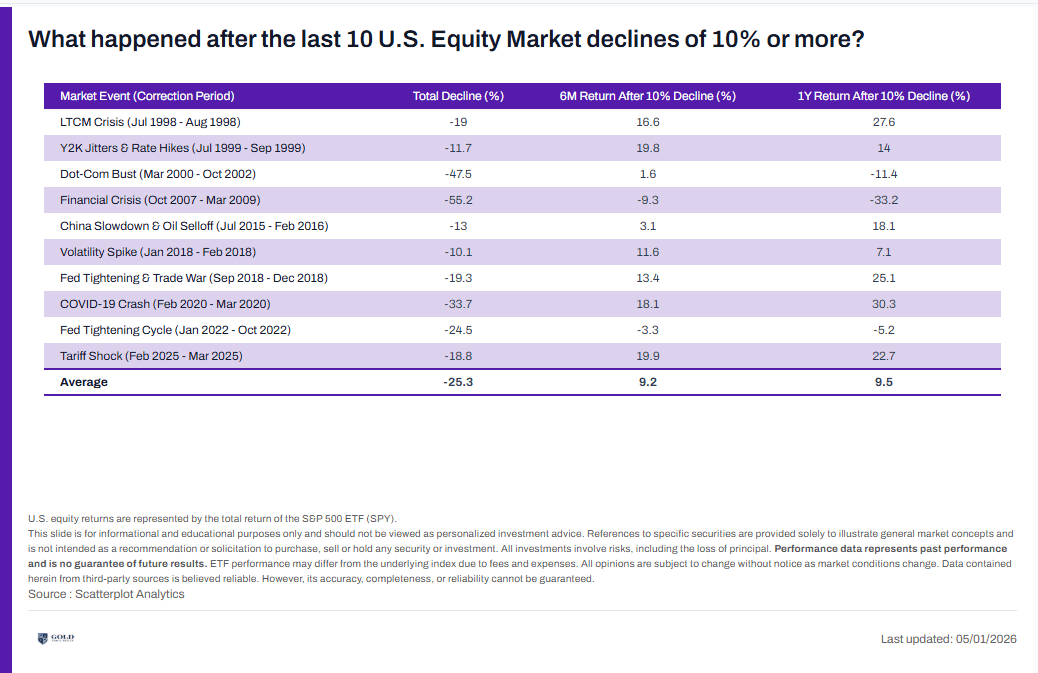
Historical Drawdowns in Context
The single most effective thing you can show a worried client is that this has happened before.
A chart plotting every S&P 500 drawdown of 10% or more over the past 40 years — labeled with the event, the depth of the drop, and the recovery timeline — does more work in 10 seconds than a 10-minute explanation.
The message isn't "don't worry." The message is: markets have recovered from worse, and your plan was built knowing this could happen.

Testing Email flow
Clients often feel like current volatility is uniquely dangerous. The VIX chart puts that feeling in context.
Showing where today's VIX reading sits relative to its 20-year range is a grounding exercise. More often than not, what feels extreme is actually within historical norms. When it isn't, you can acknowledge that honestly — and pivot to the portfolio's defensive positioning.
Closing
Clients often feel like current volatility is uniquely dangerous. The VIX chart puts that feeling in context.
Showing where today's VIX reading sits relative to its 20-year range is a grounding exercise. More often than not, what feels extreme is actually within historical norms. When it isn't, you can acknowledge that honestly — and pivot to the portfolio's defensive positioning.


Enjoyed this? Get more in your inbox.
Weekly insights for advisors
— charts, research, and practical tools. No fluff.
Platform Updates
22sujith reddy 4th blog || Charts Every Advisor Should Have Ready Before a Volatility Call
When markets move fast, clients call faster. These five visuals help you lead the conversation instead of reacting to it.
Read moreLydia Korsgaard
June 5, 2026 · 1 min read
Chart of the Month
Sujith reddy -1st blog || 5 Charts Every Advisor Should Have Ready Before a Volatility Call
When markets move fast, clients call faster. These five visuals help you lead the conversation instead of reacting to it.
Read moreSarah Okonkwo
May 14, 2026 · 2 min read