
Sujith 3rd blog4 || Why the 60/40 Portfolio Is Being Questioned — And What the Charts Actually Show
For decades, the 60/40 split was the default answer for balanced investing. Recent market conditions have put that assumption under pressure. Here's what the data says — and how to talk about it with clients.


Lydia Korsgaard
Guest Writer, Scatterplot Blog
Intro
This slide is for informational and educational purposes only and should not be viewed as personalized investment advice. References to specific securities are provided to illustrate general market concepts and are not intended as a recommendation or solicitation to purchase, sell, or hold any security or investment. ETF performance may differ from the underlying index due to fees and expenses. All investments involve risks, including the loss of principal. Past performance is no guarantee of future results. Investment returns and principle value will fluctuate and are subject to market volatility. All opinions are subject to change without notice as market conditions change. Data contained herein from third-party sources is believed reliable. However, its accuracy, completeness, or reliability cannot be guaranteed.
Source : Scatterplot Analytics
U.S. Equity Total Return and All-Time Highs
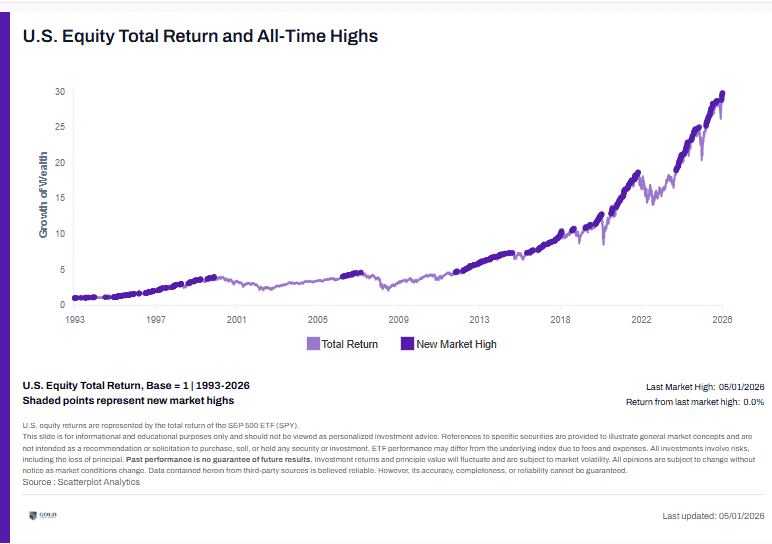
Shaded points represent new market highs


Enjoyed this? Get more in your inbox.
Weekly insights for advisors
— charts, research, and practical tools. No fluff.

Platform Updates
22sujith reddy 4th blog || Charts Every Advisor Should Have Ready Before a Volatility Call
When markets move fast, clients call faster. These five visuals help you lead the conversation instead of reacting to it.
Read moreLydia Korsgaard
June 5, 2026 · 1 min read

Chart of the Month
Sujith reddy -1st blog || 5 Charts Every Advisor Should Have Ready Before a Volatility Call
When markets move fast, clients call faster. These five visuals help you lead the conversation instead of reacting to it.
Read moreSarah Okonkwo
May 14, 2026 · 2 min read